Operational chaos does not feel like a cost centre when you are in it. It feels like the cost of doing business — like this is just what running a growing ecommerce brand looks like. It is not. Every hour your team spends manually reconciling inventory, every customer who does not come back because their order arrived wrong, every week you spend building a spreadsheet that should be a dashboard — these are line items. They just do not have a row in your P&L because no one has ever added them up.
This guide puts numbers on the real cost of Shopify operational chaos so you can make an informed decision about whether the investment in fixing it is justified. Spoiler: it almost always is, usually within the first quarter.
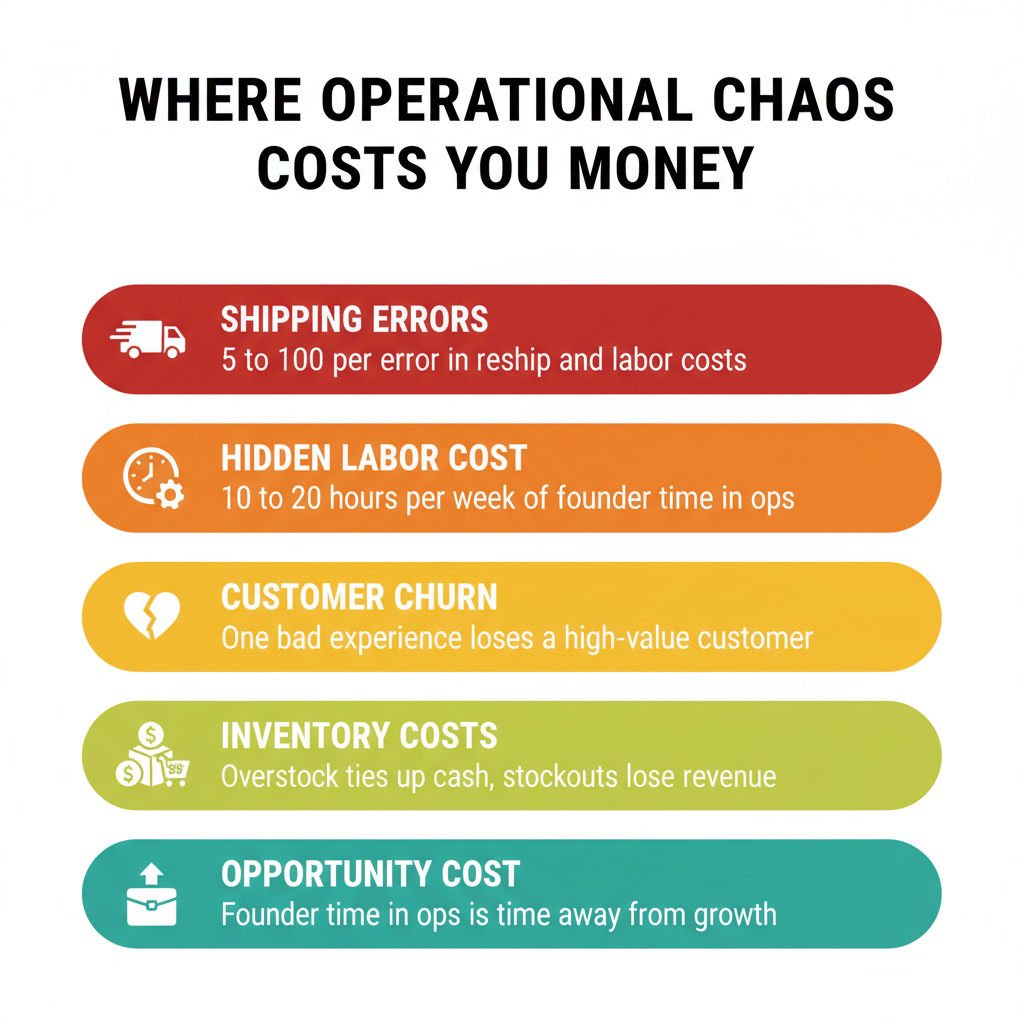
The Cost of Fulfillment Errors
Fulfillment errors — wrong item sent, correct item missing, damaged in transit due to poor packing — have both hard costs and soft costs. Hard costs are the ones you can see in your P&L: reshipping cost, return processing, refund, and the time your customer service team spends handling the ticket. Soft costs are the ones that never appear directly: the customer who does not come back, the negative review that raises your future acquisition cost, the social post that reaches their network.
Industry estimates for the hard cost of a single picking error range from $50 to $100 per incident when you factor in the replacement shipment, return processing, and support time. At a 2 percent error rate — not unusual for self-fulfillment operations without documented pick-and-pack SOPs — a brand processing 800 orders per month has 16 errors per month. That is $800 to $1,600 per month in hard costs before you count the soft costs.
The soft cost calculation is harder but more important. Research from the ecommerce sector consistently shows that a customer who has a poor fulfillment experience has a 30 to 40 percent probability of returning for a second purchase — compared to 60 to 70 percent for customers who had a good experience. If your average customer LTV is $180 and you lose 16 customers per month to fulfillment errors, you are destroying approximately $2,880 in LTV per month. That is a $34,560 annual soft cost from a 2 percent error rate.
The Hidden Labour Cost
Map every manual task your ops or customer service team performs each week that should be automated or eliminated. Most operations teams can identify 15 to 30 hours per week of preventable work when they actually write it down:
- Manually exporting orders and re-entering them in a different system (because the two systems do not integrate)
- Copy-pasting tracking numbers from shipping software into customer service tickets
- Generating weekly inventory reports by pulling from multiple spreadsheets and systems
- Chasing the 3PL for receiving confirmations that should come automatically
- Manually processing return approvals and restock adjustments
- Rebuilding the same reports every Monday morning that your CEO wants
At $28 per hour for an operations coordinator, 20 hours of preventable work per week costs $560 per week or $29,120 per year. At $45 per hour for a senior ops manager, those same 20 hours cost $46,800 per year. This is the labour cost of operational chaos — not the cost of running the business, but the cost of running it badly.
The investment to eliminate that work is almost always less than its annual cost. A $299 per month software subscription that saves 10 hours of ops time per week pays for itself in the first three weeks.
Customer Churn From Ops Failures
The relationship between operations quality and customer retention is direct and measurable. Customers who experience late deliveries, wrong items, or missing tracking numbers are significantly less likely to repurchase. For a DTC brand where margins depend on customer LTV and repeat purchase economics, this is not a minor inconvenience — it is a fundamental threat to unit economics.
Consider a brand with a $55 CAC, a $180 LTV, and a 12 percent repeat purchase degradation from ops issues (meaning ops problems lower their repeat rate by 12 percentage points versus a well-run operation). On 1,000 customers acquired in a month, that 12 percent degradation represents 120 customers who do not return. At $180 LTV, that is $21,600 in foregone lifetime revenue per acquisition cohort — caused entirely by preventable operational failures.
This calculation rarely appears in founder discussions about operational investment because the causal chain is indirect. But the data is consistent across ecommerce verticals: fulfillment quality is one of the top three drivers of repeat purchase intent, alongside product quality and price.
The Inventory Cost of Poor Forecasting
Operational chaos in inventory management manifests as either stockouts or overstock — and both are expensive. Stockouts mean lost sales: customers who wanted to buy but could not. The revenue impact of a stockout is the units you could have sold at full margin before a reorder arrived.
Overstock is more insidious because it sits on a balance sheet looking like an asset. But inventory tied up in slow-moving stock has a carrying cost: the capital that could be deployed in faster-moving SKUs or growth investment is locked in warehouse space and unsold units. For brands with 60-plus days of slow-moving inventory on hand, the annual carrying cost (capital cost, warehouse space, insurance, potential obsolescence) typically runs 20 to 30 percent of inventory value per year.
A $300,000 overstock position costs $60,000 to $90,000 per year to carry. The root cause is almost always poor demand forecasting — which is a systems and process problem, not a market problem.
The Opportunity Cost of Founder Time in Operations
For founder-led businesses, the most expensive operational cost is often the founder themselves. A founder spending 20 hours per week managing operational chaos — handling escalations, fixing broken integrations, approving manual workarounds, and attending to fires that should not exist — is a founder who is not building product, selling, or raising capital.
The opportunity cost is not abstract. Every hour a founder spends in operational detail is an hour not spent on the activities that drive company value. At a conservative valuation of $200 per hour in strategic founder time (which understates it for growth-stage businesses), 20 hours per week is $4,000 per week or $208,000 per year in foregone founder leverage. This is the real cost that never appears in any budget discussion but is perhaps the most important number on the list.
How Operational Chaos Compounds
The danger of operational chaos is not any single cost — it is the compounding. A 2 percent fulfillment error rate at $500K revenue is annoying but manageable. At $2M revenue with the same error rate, it is a structural problem. At $5M revenue, it is existential. The same processes that barely worked at $500K actively break the business at scale.
Every operational problem that is not fixed today is a problem that gets more expensive every quarter as order volume grows. The cost of fixing a manual inventory process at $1M revenue is a fraction of the cost of fixing it at $5M when you have more SKUs, more channels, more team members, and more customers affected by every failure.
The right time to fix operations is not when you are in crisis — it is before the crisis, when the cost of fixing is still proportional to the revenue it protects.
How to Calculate Your Ops Chaos Cost
Add these up for your business in a given month:
- Fulfillment error cost: Orders per month × error rate × $75 (blended hard cost per error)
- LTV destruction: Orders per month × error rate × LTV × 0.4 (the portion of error-affected customers who churn)
- Manual labour cost: Manual ops hours per week × 4.3 × hourly rate
- Inventory carrying cost: Overstock value × 25% ÷ 12 (monthly carrying cost)
- Founder time cost: Founder ops hours per week × 4.3 × strategic hourly rate
Total that number. Compare it to the cost of the solution — software, consultant fees, implementation time. In nearly every case, the monthly cost of the chaos exceeds the monthly cost of fixing it. The question is not whether to invest in operations. It is how long you can afford not to.
ScaleOps Consulting builds operational infrastructure for Canadian product brands. If you want a clear picture of what your current ops are costing you, book a free discovery call.
Frequently Asked Questions
What does operational chaos cost an ecommerce business?
A single fulfillment error costs $50 to $100 in hard costs and $200 to $400 in LTV impact. A brand with 1,000 orders per month at a 2 percent error rate incurs $1,000 to $2,000 per month in direct costs and potentially $4,000 to $8,000 in LTV destruction. Manual labour costs typically add another $1,500 to $4,000 per month in preventable ops work.
How much time does manual operations work waste?
Most operations teams without proper systems spend 15 to 30 hours per week on preventable manual tasks. At $25 to $35 per hour for ops staff, that is $19,500 to $54,600 per year in avoidable labour cost.
Does poor operations cause customer churn?
Yes. Research shows 60 to 70 percent of customers with a bad fulfillment experience do not return. Fulfillment quality is one of the top three drivers of repeat purchase intent alongside product quality and price.
What is the opportunity cost of a founder spending time on operations?
At a conservative $200 per hour in strategic founder value, 20 hours per week in operational detail costs approximately $208,000 per year in foregone strategic leverage. This is typically the largest single component of operational chaos cost for founder-led businesses.
How do you calculate whether fixing operations is worth the investment?
Total your monthly ops chaos costs: error cost, LTV destruction, manual labour, inventory carrying cost, and founder time. Compare to the monthly cost of the solution. In most cases, the ROI pays back within three to six months. The right time to invest is before the crisis, not during it.
Keep reading
- How to Integrate Amazon and Shopify: Sync Inventory, Orders, and Listings
- How to Automate Shopify Order Processing (Without Breaking Anything)
- E-commerce Fraud Prevention: How to Protect Your Shopify Store
- International E-commerce: How to Expand Your Shopify Store Globally
Need hands-on help? Explore our Shopify Operations →